인기 있는 빅 데이터 시각화 도구 Top 4 | 웹 스크래핑 툴 | ScrapeStorm
개요:This article will introduce 4 useful big data visualization tools. ScrapeStorm무료 다운로드
Big data is entering people’s lives. Although obtaining data is not a big problem, many people do not know how to draw conclusions because there is too much data. Therefore, I am here to provide 4 useful big data visualization tools to help you understand the data.
1. Datawrapper
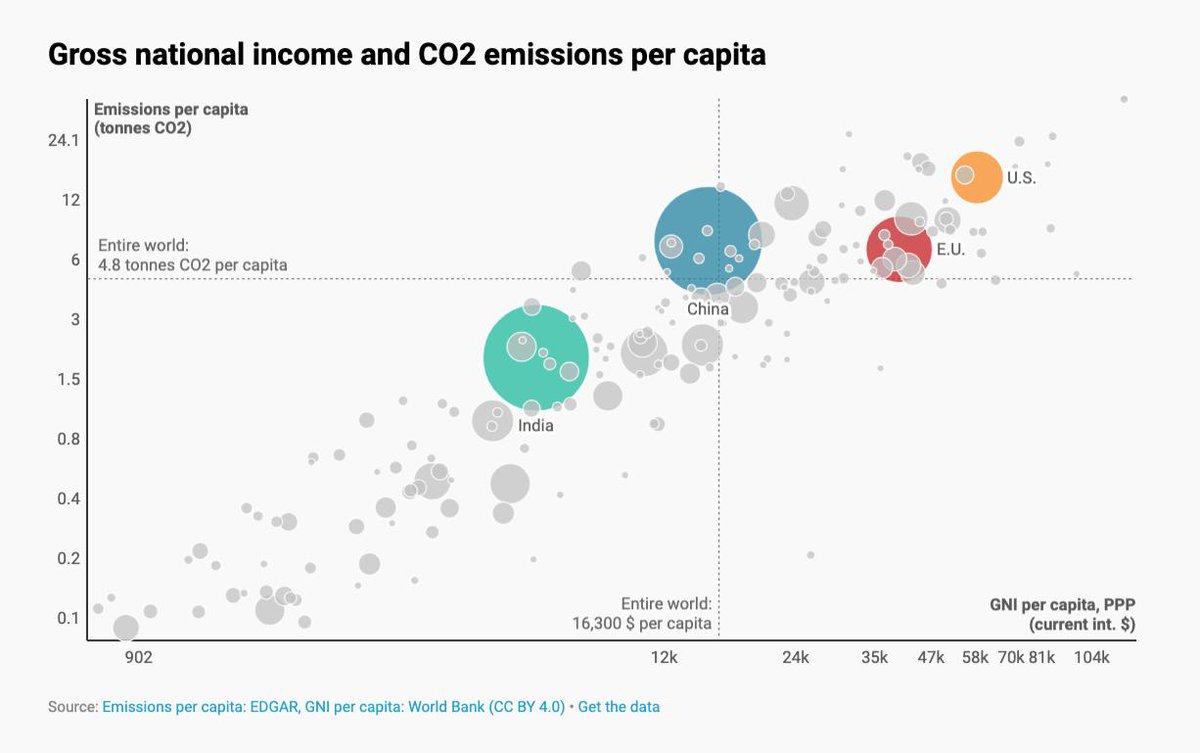
Datawrapper is an online data visualization tool for making interactive charts. Once you upload the data from the CSV file or paste it directly into the field, Datawrapper will generate a bar, line or any other related visualization file. Many journalists and news organizations use Datawrapper to embed real-time charts into their articles. It is very easy to use and produce effective graphics.
2. Tableau Public
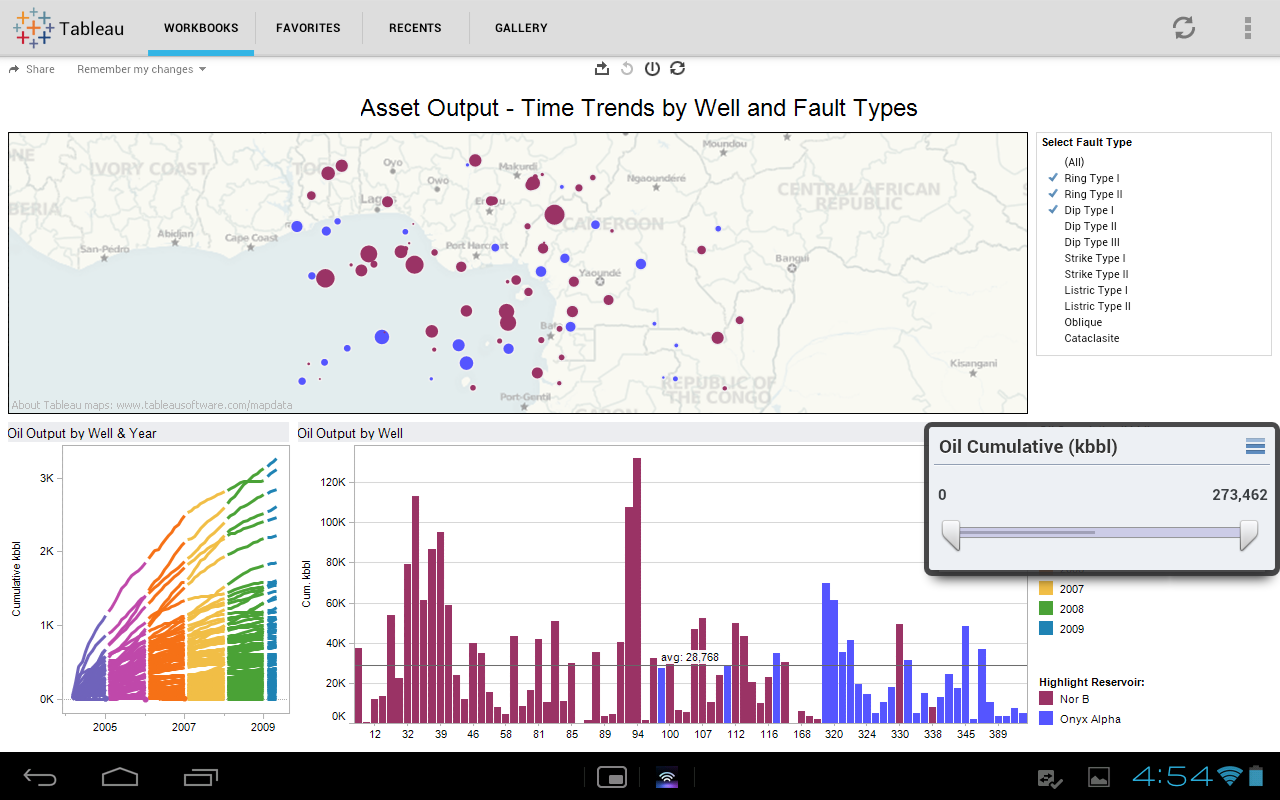
Tableau Public perfectly grafts data operations with beautiful charts. Its program is easy to use, companies can use it to drag and drop large amounts of data onto the digital “canvas”, and create various charts in a blink of an eye.
3. Chart.js
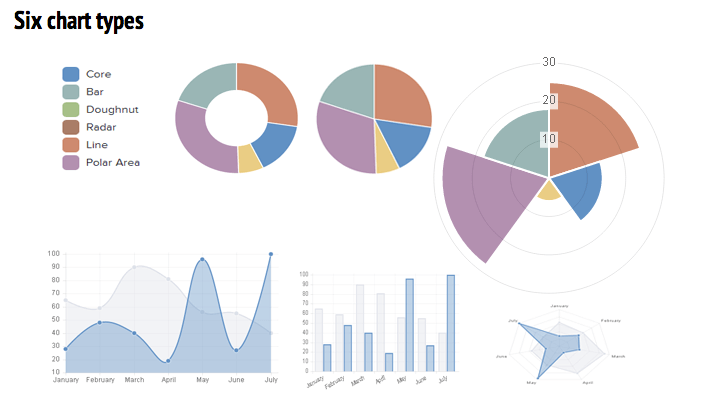
Chart.js is a free open-source JavaScript library for data visualization, which supports 8 chart types: bar, line, area, pie (doughnut), bubble, radar, polar, and scatter. Chart.js renders in HTML5 canvas and is widely covered as one of the best data visualization libraries.
4. D3.js
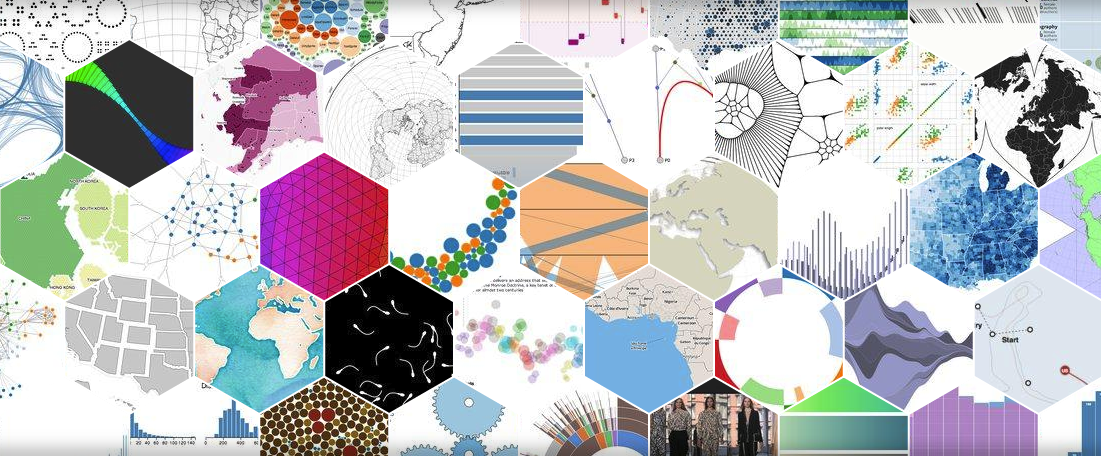
D3.js is a JavaScript library for manipulating documents based on data. D3 helps you bring data to life using HTML, SVG, and CSS. D3’s emphasis on web standards gives you the full capabilities of modern browsers without tying yourself to a proprietary framework, combining powerful visualization components and a data-driven approach to DOM manipulation.
면책 성명: 이 글은 우리 사용자에 의해 기여되었습니다. 침해가 발생한 경우 즉시 제거하도록 조언해 주세요.